Participating in the game of life should be easy, not a quest with endless side quests. Yet, our system makes it feel like a poorly designed video game. We’re stuck with tedious tasks at the DMV, interrupting our main quest.
We design our systems for a perfect, time-rich, and money-rich “user” who doesn’t exist. The real world is full of friction. Vote.org says we treat participation as an interruption, asking people to stop their lives for it.
This isn’t just about ramps and railings. It’s about the architecture of exclusion. The Level Playing Field group says people are disabled by a world not built for them. Barriers are environmental, physical, and even attitudinal.
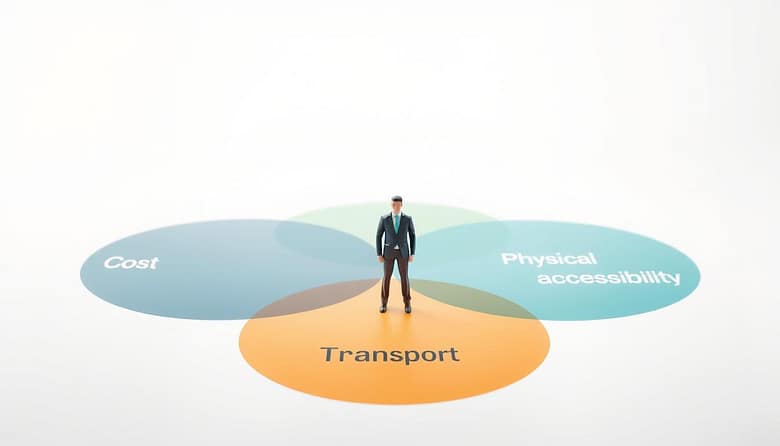
This section is a diagnostic. We’re mapping the triathlon of exclusion: the financial gate (Cost), the logistical labyrinth (Transport), and the systemic oversight of Disability. We’ll explore how bad design creates barriers. Before we can build a better system, we must acknowledge the stairs we’ve built.
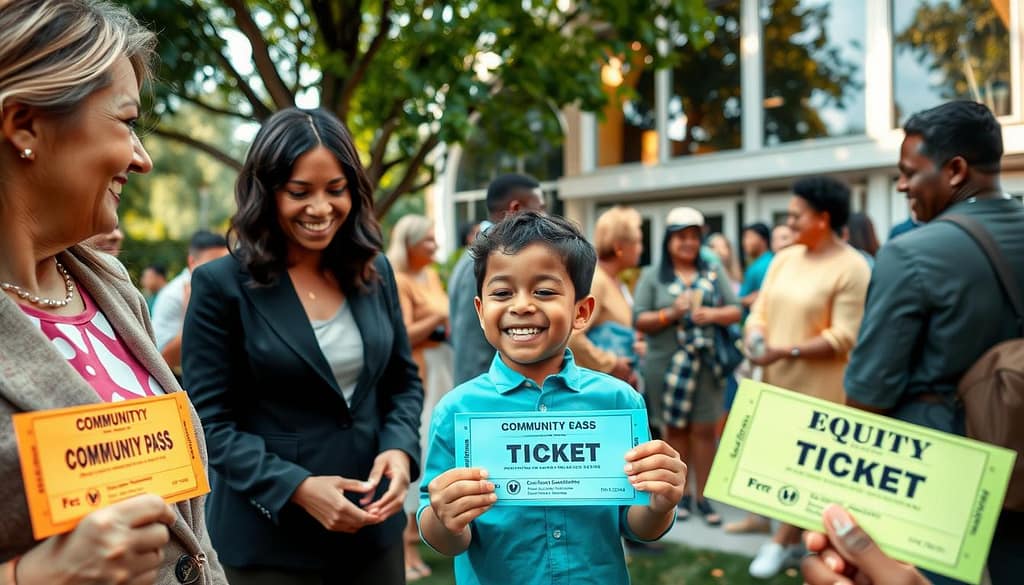
Ticket Equity and Community Passes
Equity in ticketing isn’t just about cheaper seats. It’s about making sure everyone can enter the stadium. For too long, ticket prices have kept some people out, saying it’s because of “market value.” But what if tickets were keys to joining the community?
This shift changes how we think about tickets. It moves from giving a few cheap seats to making the whole pricing system fair for everyone.
Groups like Level Playing Field push for more than just physical accessibility. They want economic accessibility too. Their work with clubs isn’t just about ramps and wider areas. It’s about changing how money is made to include more people.
This isn’t about feeling sorry for others. It’s about making the stadium more lively by having a diverse crowd.
An unexpected way to achieve this is through crowd management guides. They suggest “family enclosures” to manage crowds. These areas can be made into equity zones with different ticket prices or passes. This turns crowd control into a way to make events more accessible.
The goal is to change from giving free tickets to making a fair pricing system. This is a big difference. The former is a small gesture, while the latter is a big change.
The table below shows the difference between old charity models and new equity models:
| Ticket Model | Price Philosophy | Target Demographic | Inclusivity Quotient |
|---|---|---|---|
| Traditional Single-Game | Dynamic, demand-based pricing | High-income, corporate clients | Low. Excludes based on income. |
| Season Pass (Standard) | High upfront cost, per-game discount | Dedicated fans with disposable income | Medium. Rewards loyalty but has a high barrier to entry. |
| Community Pass (Subsidized) | Sliding scale, pay-what-you-can options | Students, seniors, low-income families | High. Actively reduces financial barriers. |
| Family/Community Enclosure | Subsidized, flat family/group rate | Families, youth groups, community orgs | Very High. Builds long-term community ties. |
Creating this change needs more than just good intentions. It needs partnerships. Cities like Toronto are already working on this. The Toronto for All initiative is a great example. It makes events more accessible to everyone.
This isn’t about giving away tickets. It’s about making the community stronger. By changing ticketing, we don’t just fill seats. We fill the stadium with the community it’s meant to serve.
Inclusive Amenities and Communication
You’ve bought your ticket and entered the venue. Now, the real test starts. An accessible entrance is important, but it’s not enough. The experience inside must be welcoming to all.
Once inside, you expect more than just the game. You want to grab a drink, buy a shirt, and use the restroom easily. But, if food stands are crowded and bathrooms are hard to reach, it’s not fair. Good intentions at the ticket booth are undone by poor planning.
The Spectator Violence Guide offers surprising insights on inclusion. It shows how to design facilities for everyone’s comfort. Placing food stands in one area may control crowds, but it’s unfair to fans. The guide suggests placing amenities wisely to make things affordable.
Clear signs are essential and very affordable. They help fans navigate easily and avoid frustration. Good signage is like a map, making the venue feel welcoming.
Video screens and sound systems are not just for some. They make the event better for everyone. They turn spectators into part of the crowd, making the experience affordable.
This isn’t about fancy features. It’s about the basics of communication and accessibility. A good restroom and clear signs are not extras; they’re necessities. They show respect for all fans.
The affordability of a ticket means nothing if you’re uncomfortable or treated unfairly. Inclusive amenities and clear communication make fans feel valued. They turn a passive ticket-holder into a true fan.
Measuring Participation and Satisfaction
In the world of inclusion, participation trophies are often given for effort, not impact. We’ve seen them: glossy reports with smiling faces and “awareness raised” metrics. But what if we could swap those for actual data trophies—hard numbers that prove our efforts work?

Let’s look at Vote.org’s #OnASideQuest campaign. It wasn’t about raising “awareness” about voter registration. It was about numbers: 10,736 website visitors, 5,490 new registrations, 9,396 status verifications, and 14,886 total actions. That’s not a participation trophy; that’s a data trophy. When you can point to 5,490 people who can now vote, you’re changing lives with precision.
This is where the real work starts. We can use the Spectator Violence Prevention Guide to understand what went right. After-action reports help us understand success. They ask tough questions: How many first-time attendees showed up? What was the satisfaction score in the new family section? Did concession sales increase with better crowd flow? These questions are about ROI, not just feel-good answers.
Let’s get specific with the Vote.org data:
| Metric | Result | What It Tells Us |
|---|---|---|
| Website Visitors | 10,736 | Campaign reach and initial interest |
| New Registrations | 5,490 | Core success metric – actual new voters |
| Status Verifications | 9,396 | Engagement beyond initial action |
| Total Actions | 14,886 | Overall campaign engagement |
| Social Shares | 500+ | Organic reach and amplification |
This isn’t just data—it’s a story. Each of those 5,490 registrations is a person who can now vote. Each of those 14,886 actions shows a decision to engage with democracy. This is how we move from “we think this works” to “we know this works because the numbers prove it.”
The true affordability of measurement isn’t in the budget for analytics software. It’s in the cost of not measuring. When you can show, with data, that your inclusive practices work, you’re not just asking for funding. You’re presenting an ROI that even the most skeptical CFO can’t ignore. This is where the real empowerment happens: when data becomes the bridge between good intentions and measurable impact.
Consider the after-action report as your new best friend. It forces you to ask: Did the new quiet room for neurodiverse attendees actually get used? Did the ASL interpreters increase participation from the Deaf community? Did the “pay-what-you-can” ticket tier actually reach new audiences, or just give discounts to those who could afford full price? These aren’t just feel-good questions—they’re the difference between a PR-friendly inclusion statement and actual, measurable progress.
The most affordable inclusion strategy is the one that works. And the only way to know what works is to measure everything. Track your attendance demographics against the community demographics. Survey satisfaction—not just overall, but broken down by accessibility needs. Count the actual numbers, not the warm fuzzies. Because in the spreadsheet of social progress, the bottom line is impact, not intention.
Partnering with Schools and CBOs
Working alone, even with great passion, can feel like shouting into the void. But, real change happens when we connect with others. True inclusion is about building a network, not just running a program.
The Vote.org campaign shows how powerful networks can be. It wasn’t just Vote.org; it had the NAACP, Yale, and The Smithsonian on board. When a young congressman and Amanda Gorman joined, the message became a cultural movement.
The Level Playing Field initiative is another great example. It started with football but helped other sports too. By sharing knowledge, they made inclusion a standard, not just for football.
Our goal is to make everyone see inclusion as their responsibility. This is different from the old model where one group did it all. Now, we work together, making inclusion a team effort.
To build this coalition, start by understanding your ecosystem. Look for trusted voices in your community. These are the people who can help spread your message.
Don’t just give them your program; work together. Offer tools and practices, and let them make it their own. This way, inclusion becomes a shared value in the community.
The last step is to move from awareness to action. Schools and CBOs need to be able to include everyone. Your coalition can help by providing training and tools.
When everyone sees inclusion as a core value, you’ve achieved something big. You’ve built a strong network for inclusion that can last.
Storytelling with Dignity
You’ve got the venue, pricing, and community partners sorted. But you’re missing the story. Not the kind that makes you feel bad, but the kind that makes you feel good. This is where storytelling becomes key.
The #OnASideQuest campaign is a great example. Vote.org didn’t preach about voting. They called it a “side quest,” using gaming terms. It was fun, smart, and showed respect for people’s smarts. It was storytelling with a smile, not a scold.
Level Playing Field started differently too. It didn’t start with a sad story. It started with disabled fans at a kitchen table, fixing their own problems. This shows a story of power, not weakness. It’s about the kitchen table, not the soapbox, where real stories start.
True inclusion means avoiding “inspiration porn” and shame. It’s about telling stories with respect, like the Dare2Dialogue project. It uses real stories to start real talks. When we let people tell their own stories, we create true inclusion. The last hurdle is boring, condescending talk. The future is for the best storytellers.