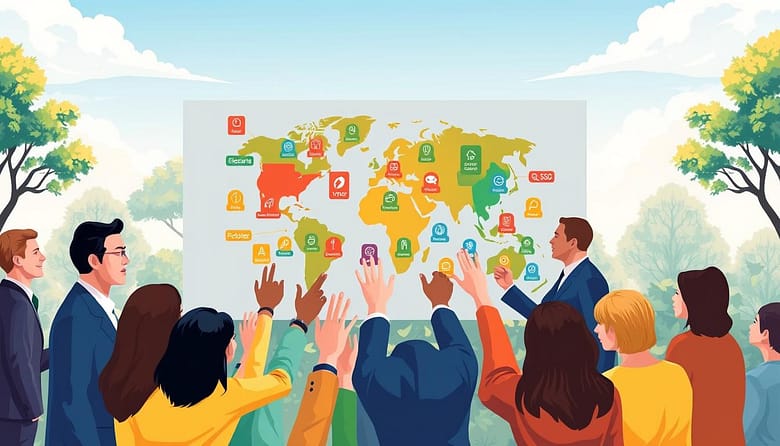
In 2015, all United Nations Member States agreed on a powerful vision. The 17 Sustainable Development Goals (SDGs) are a shared blueprint for peace and prosperity. They aim for a better future for people and the planet.
This call to action is not just for governments. Organizations of all sizes can use it too. When your events and marketing align with these global goals, they gain deep meaning.
Choosing the right goals is key. You need to consider your mission, resources, and impact. A scattergun approach wastes effort.
Haymarket Media Group is a great example. They focused on SDG 13: Climate Action. This targeted approach avoids wasting resources and drives real change.
The clock is ticking toward the 2030 deadline. It’s now urgent for businesses to implement the SDGs. Start by mapping your mission to the goals that matter most.
Theory of Change for Sports Campaigns
The theory of change is like a compass for sports projects. It guides them from the start to lasting success. It’s key for reaching the UN Sustainable Development Goals (SDGs).
It shows how actions lead to real results. A clear plan connects every step. For example, a soccer clinic can improve health (SDG 3) or a cycling program can fight for gender equality (SDG 5).
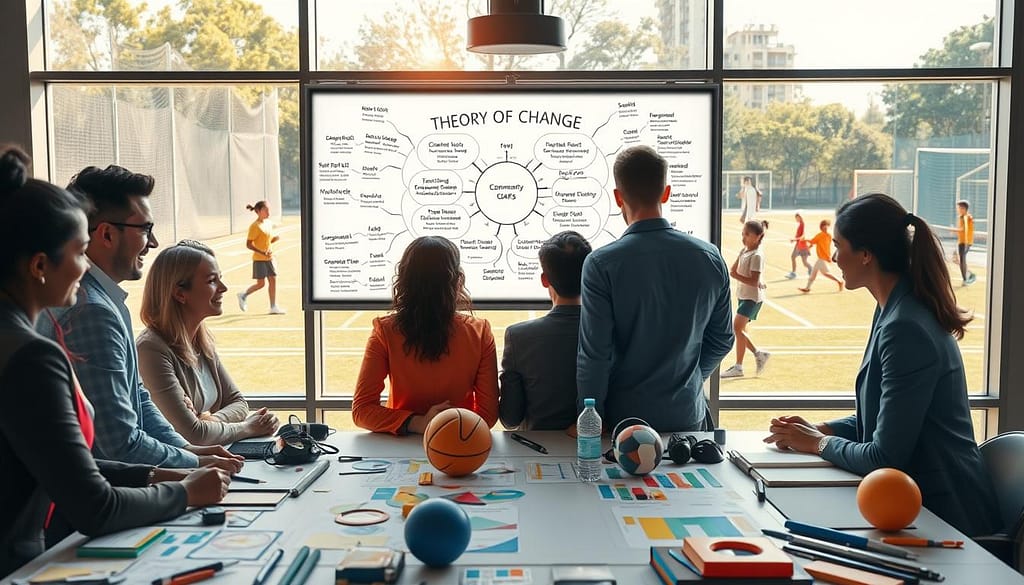
A theory of change breaks down a campaign’s path. It goes from inputs and actions to outcomes and impact. Each step must be clear and measurable.
This approach turns hopes into a solid plan. It answers the “how” and “why” of every event. For sports organizers, it proves their worth.
| Component | Definition | Sports Campaign Example |
|---|---|---|
| Inputs | Resources invested: funding, staff, equipment, venues. | Bicycles, mechanics, safe routes, and volunteer trainers. |
| Activities | Actions performed: training sessions, tournaments, workshops. | Weekly “Pedal Power” cycling classes for refugee women. |
| Outputs | Direct, countable products of activities. | 50 women completed a 6-week cycling proficiency course. |
| Outcomes | Short to medium-term changes for participants. | Increased mobility, new social connections, improved confidence. |
| Impact | Long-term contribution to broader SDGs. | Advancement of gender equality (SDG 5) and climate action (SDG 13) through sustainable transport. |
The Bike Project’s Pedal Power shows this in action. They start with bikes and training. The result is skilled cyclists.
Women gain independence and social ties. This leads to a big impact on SDGs. Every action has a purpose.
Creating a strong theory of change means thinking backwards. Start with the goal, like quality education (SDG 4) or less inequality (SDG 10). Then, plan the steps to get there.
This method is key for sports for development. It gets funding and support. Without it, campaigns are just events. With it, they change lives.
A solid theory of change does more than plan. It shows your mission’s strength. It uses sport to aim for a better world.
Logic Model and KPIs
A strong logic model is key. It links every campaign action to its social and environmental goals. This visual guide ensures resources are used wisely, leading to real change. For campaigns tied to the SDGs, it connects local efforts to global goals.
The logic model breaks down your campaign into five parts. Each part builds on the last, showing a clear path to results.
- Inputs: The resources you use. This includes staff, budget, equipment, and partnerships.
- Activities: The actions you take with those resources. Examples are clean-up events, workshops, or recycling drives.
- Outputs: The direct results of your actions. This includes events held, people trained, or waste collected.
- Outcomes: The short-term and medium-term changes from your outputs. These are changes in knowledge, behavior, or community conditions.
- Impacts: The long-term, broader changes that help the SDGs. This is the main reason for your work.
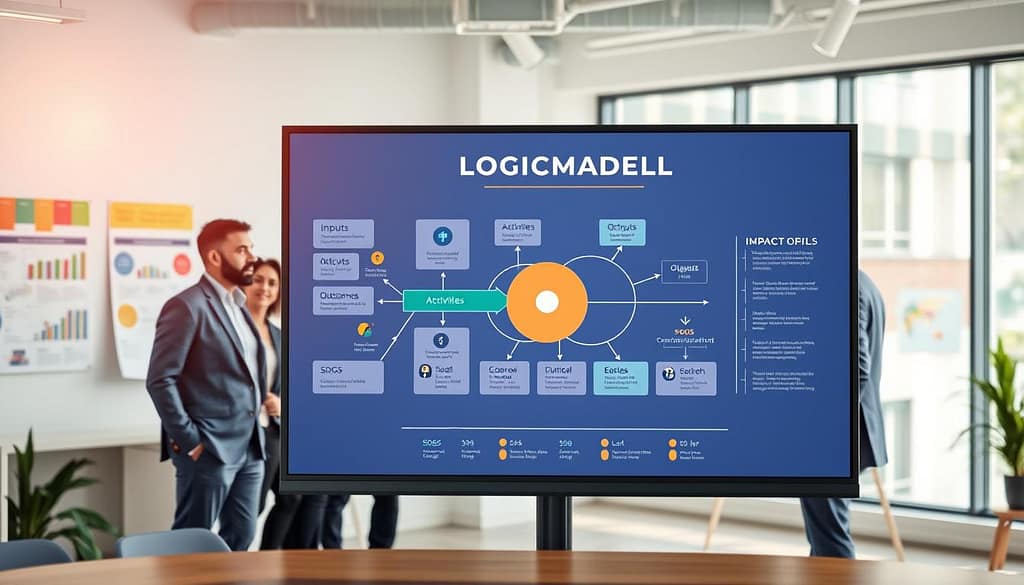
From this model, you get your Key Performance Indicators (KPIs). Good KPIs are specific and tied to SDG targets. This links your local data to global reporting.
FoodCycle is a great example. They measure impact against SDG 2 (Zero Hunger) and SDG 3 (Good Health). They track tons of food saved and community engagement. These metrics show real change.
Your KPIs should be SMART: Specific, Measurable, Achievable, Relevant, and Time-bound. Instead of “increase awareness,” aim for “Increase knowledge of water conservation by 40% in six months, as shown by surveys.”
The table below shows how to make KPIs for different SDG campaigns.
| SDG Focus | Campaign Activity | Sample Output KPI | Sample Outcome KPI |
|---|---|---|---|
| SDG 13: Climate Action | Community Tree Planting | Number of trees planted (e.g., 500 trees) | Percentage increase in community understanding of carbon sequestration (e.g., 60% of participants) |
| SDG 5: Gender Equality | Women’s Sports Leadership Workshop | Number of workshops held (e.g., 10 sessions) | Number of participants who secure a leadership role in a sports club within one year |
| SDG 12: Responsible Consumption | Stadium Plastic Reduction Pledge | Number of single-use plastic items eliminated (e.g., 50,000 bottles) | Percentage reduction in stadium waste sent to landfill per event |
This method turns stories into proof. It shows your value to stakeholders and helps you adjust strategies based on data. Data-driven decision-making is now a must for credible advocacy.
By setting clear impact metrics from the start, campaigns can show real progress. This effort is what makes a difference, not just good intentions. Your logic model and KPIs are the keys to measuring lasting change.
Data Collection and Story + Data Reporting
To make a real impact, organizations need to collect and share both numbers and stories. The true value of your campaign comes from combining impact metrics and personal stories. This mix turns goals into clear signs of progress.
First, decide what data to gather. Make sure your metrics match the SDGs your event aims to support. You can collect data through:
- Post-event surveys to see if people learned and changed.
- Digital analytics to track how people engage with your campaign.
- Waste audits and carbon footprint checks for environmental goals.
- Pre- and post-assessments for educational projects.
The United Nations leads with its SDG Progress Reports. Use these reports to pick indicators that are recognized worldwide. This adds credibility and lets you compare your work to global efforts.
But numbers alone don’t spark action. That’s where storytelling comes in. Charities like Engineers without Borders UK share both numbers and personal stories. They talk about funds raised and how they’ve helped students.
Your report should mix data and stories. For example, report “500 trees planted” and share a volunteer’s story about why it matters. This makes your impact metrics both memorable and touching.
Being open in your reporting builds trust. Explain how you collected your data, what you couldn’t measure, and what you learned. This shows you’re honest and turns mistakes into lessons for the future.
Today’s tools make reporting easier. Platforms like digitizing sustainability performance help sports leaders track and share data quickly. This makes your reports more current and engaging.
Good reporting shows what you did and how it made a difference. It links your local efforts to the global SDGs, proving your campaign is part of a bigger movement.
Governance and Risk Management
Good governance and risk management are key for SDG projects. They make a campaign strong, accountable, and lasting. Without them, even the best theory of change can fail under pressure.
The Sustainable Development Goals show the way. SDG 16 focuses on peace, justice, and strong institutions. SDG 17 talks about the importance of partnerships. Your campaign should follow these ideas.
To build a strong governance structure, first find out who’s involved. This includes your team, partners, funders, and the people you help. Make sure everyone knows their role and who they answer to. Make sure your actions match the SDGs by adding them to your plan.
- Resource Shortages: Lack of money or volunteers can stop progress.
- Target Misalignment: If your actions don’t match the SDGs, your impact lessens.
- External Disruptions: Changes in politics, climate, or social issues can mess up plans.
To avoid these risks, plan ahead. Have backup plans for important resources. Check if your actions match your theory of change often. For risks outside your control, be ready to adapt. Work with different groups (SDG 17) to be more flexible and strong.
Places like the UN High-level Political Forum on Sustainable Development show how it’s done. They use many groups to check progress, share ideas, and handle big risks. Do the same in your campaign by creating ways for feedback and clear reports.
Strong governance and risk management keep your work honest and lasting. They protect your mission, help your partners, and make your work count towards the SDGs. This careful approach makes your project a lasting change, not just a short-term effort.
Templates and Calendars for the Year
A structured calendar is your roadmap for action. The 2030 Agenda gives a 15-year plan for the SDGs. Your annual plan breaks this into steps you can take.
Align your campaign timeline with major UN events. The SDG Summit and High-Level Political Forum are key milestones. They help you stay on track with global reviews.
Use a quarterly template to schedule activities. Organizations like FoodCycle plan weekly meal programs. Haymarket sets clear certification timelines. Your template should list tasks, teams, and deadlines.
Integrate your impact metrics tracking into the calendar. Schedule regular data collection points. This turns goals into measurable monthly actions.
A visual calendar shows your annual rhythm. It highlights busy periods and allows for flexibility. This tool keeps your team moving toward the SDGs.
Download a sample annual planner. Adapt it to your organization’s capacity. Start by blocking out known events, then build your campaign activities around them. Consistent planning turns ambition into achieved targets.