
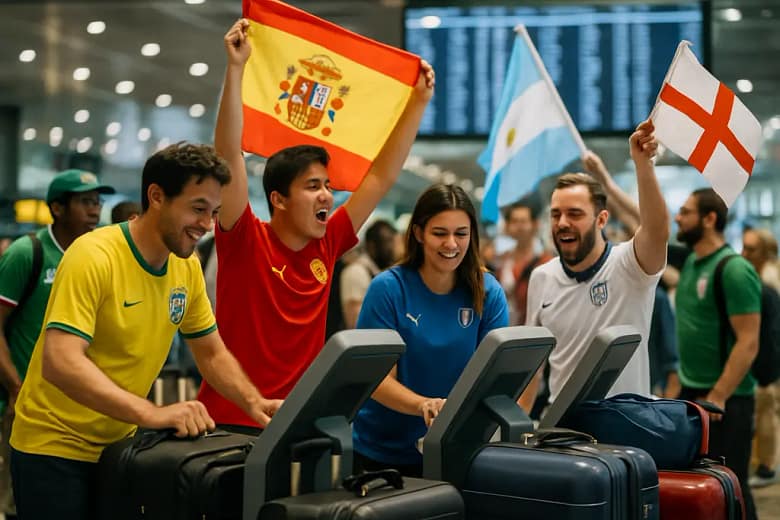
World Cup Travel Demand during the 2026 FIFA World Cup was real, but the economic impact was not evenly shared across host cities, hotel markets, and transport systems. The tournament ran from June 11 to July 19, 2026, across North America, and by September 17, 2026, the clearest lesson was that a full stadium did not automatically mean uniform gains for every local business.
The sports story came first. Match allocation, kickoff calendars, stadium location, and the concentration of international supporters shaped who benefited. Cities with high-value room inventory, strong visitor spending, and transport links near fan activity were better positioned than markets where regular business travel or local demand may have been displaced.
That distinction matters for industry leadership in sport. Host-city officials, tourism boards, clubs, venues, and athlete advocates should treat mega-event travel as a performance system, not just a visitor count. The better question after the 2026 tournament was not whether fans traveled. They did. The harder question was which parts of the host economy converted that movement into durable value.
World Cup Travel Demand And The North American Scorecard
The macroeconomic numbers were significant, though they were estimates rather than audited local outcomes. S&P Global estimated on June 3, 2026, that Mexico could receive about 5 million international visitors during June and July, compared with a usual 3.1 million for those months, with incremental tourism revenue near US$2.3 billion, equal to about 0.1% of Mexico’s GDP S&P Global analysis.
Allianz SE estimated on June 10, 2026, that the tournament would generate about US$9 billion in GDP growth across North America during the six-week event: US$6.1 billion for the United States, US$1.7 billion for Mexico, and US$1.3 billion for Canada. Its analysis also put tourism-related expenditure at about US$8 billion, including US$6.8 billion from foreign tourism exports and US$1.2 billion from domestic consumption Allianz research.
World Cup Travel Demand In Macro Terms
World Cup Travel Demand in that frame was large enough to register at a continental scale. Yet national estimates can hide local variation. A host city with multiple high-profile fixtures had different conditions from a city with fewer matchdays, a stadium farther from hotel clusters, or a hotel market already running near normal seasonal peaks.
The tournament also showed why sports-event impact studies need careful language. “Visitors” are not the same as net new visitors, and room-rate gains are not the same as broad community benefit. Some spending shifted from one place to another, some regular travel may have been avoided, and some cities saw stronger rate gains than occupancy gains. Those patterns do not negate the event’s value, but they do narrow what leaders can honestly claim.
Hotels Converted Rate Power Into Revenue
Hotel performance became one of the clearest signals from the 2026 World Cup. Research supplied for this analysis reported about US$680 million in incremental rooms revenue across the 11 U.S. host cities during match weeks. New York alone accounted for roughly US$339.2 million of that figure, indicating how a large, high-rate lodging market could dominate national hotel gains.
The same hotel data showed a more cautious finding: seven of the 11 U.S. host markets had softer occupancy during match weeks compared with a counterfactual baseline. Seattle was down about 6.3 percentage points, Kansas City and Miami about 4.6 points, Philadelphia about 3.5 points, Atlanta about 2.6 points, Houston about 1.8 points, and Boston about 0.5 points.
Rate Discipline Beat Pure Occupancy
Even with those occupancy declines, average daily rates rose sharply enough that revenue per available room increased in all 11 U.S. host cities during match weeks. New York’s RevPAR gain was reported at US$55.51, Boston’s at US$32.80, and Atlanta’s at about US$1.96, the lowest gain among the cited markets.
That pattern is instructive for future hosts. A market can earn more hotel revenue even while filling fewer rooms than expected, if rates rise enough. But from a community-impact perspective, the distribution of that gain is narrow. Hotel owners and operators may benefit, while restaurants, retail corridors, local workers, and transit agencies experience a different result depending on where fans stay and how they move.
Short-term rental markets showed a related tension. In U.S. host metros, asking rates were reported to have risen about 19.8% during June 12 to July 19, 2026, compared with matched non-host metros, while occupancy for those listings fell about 4%. The signal was similar: pricing power improved, but demand did not rise uniformly across all available beds.
City Outcomes Varied By Match Load And Market Base

The strongest local outcomes appeared to depend on several sports-specific factors: how many matches a city hosted, how attractive those fixtures were for international travel, whether the stadium connected well to hotel districts, and how much ordinary travel was displaced. These are planning issues, not just tourism issues.
Week 1 hotel indicators showed the spread. Host-city hotel RevPAR was reported to have climbed between 24% and 133% compared with the same week in 2025, driven largely by rate increases. Yet only a few cities, including San Francisco, New York, and Los Angeles, were reported to have seen occupancy increases, while others saw occupancy fall, with Guadalajara cited as down by up to about 35%.
How World Cup Travel Demand Reached Streets And Stations
Atlanta offered a useful case because the reported data connected hotel rooms with public transit. From June 13 to July 16, 2026, visitors booked about 442,000 hotel room nights. Compared with the same dates in 2025, occupancy in Atlanta’s host-market hotels fell about 4%, while revenue per available room increased about 11%. MARTA rail usage during the World Cup period reached about 4.66 million trips, around 1.6 times the typical level for the same dates in 2025.
That combination suggests a host city can have meaningful event movement even when hotels do not fill at the level promoters might expect. Transit ridership, fan zones, stadium access, and matchday operations can carry much of the visible public impact. For venue and civic leaders, those operational details belong in the first draft of economic planning, not as afterthoughts.
For readers interested in how sports tourism intersects with local communities and sports venues, Texas Sportsmen provides coverage that connects these elements comprehensively.
Why Smaller Markets Could Still Outperform
One striking hotel finding in the research set was Kansas City’s reported RevPAR performance across a hotel audit of U.S. and Canadian host cities. Kansas City ranked first in that audit, with RevPAR up about 51%, powered by a 42% increase in average daily rate and a 6% occupancy lift. That outpaced larger metros cited in the same research, including Los Angeles at about 22% RevPAR growth and Dallas at about 18%.
The sports-business lesson is that scale alone did not decide the outcome. A smaller market could outperform if match timing, room supply, fan concentration, and pricing strategy aligned. This is valuable for future bids because it challenges the assumption that only global gateway cities can convert tournament traffic efficiently.
What Host Cities Learned From The 2026 World Cup
World Cup Travel Demand did not behave like a simple rising tide. It lifted room rates across U.S. host cities, supported major tourism-spend estimates across North America, and pushed visible public movement in places such as Atlanta. It also exposed softer occupancy in several markets and showed that revenue gains can be concentrated by geography and sector.
For athletes and teams, this matters because mega-events shape the environments around competition: travel loads, fan access, training logistics, and civic investment all affect the event experience. For industry leaders, the evidence points to a practical standard. Host planning should track net new visitors, rate effects, transit usage, match distribution, local-worker impact, and neighborhood-level spending rather than relying only on headline attendance or national GDP estimates.
- Use match calendars to forecast hotel and transit demand by date, not by month.
- Separate room-rate gains from broader local spending before making economic claims.
- Compare host results with realistic baselines, including displaced business and leisure travel.
- Plan stadium access around fan movement patterns, not only venue capacity.
The 2026 World Cup produced major travel and spending signals, but the evidence supports a measured reading. The event rewarded cities that converted football crowds into efficient transport use, disciplined pricing, and concentrated visitor spend. It gave a weaker return where demand was uneven or where higher prices coincided with lower occupancy. That is the host-city playbook worth carrying forward.