
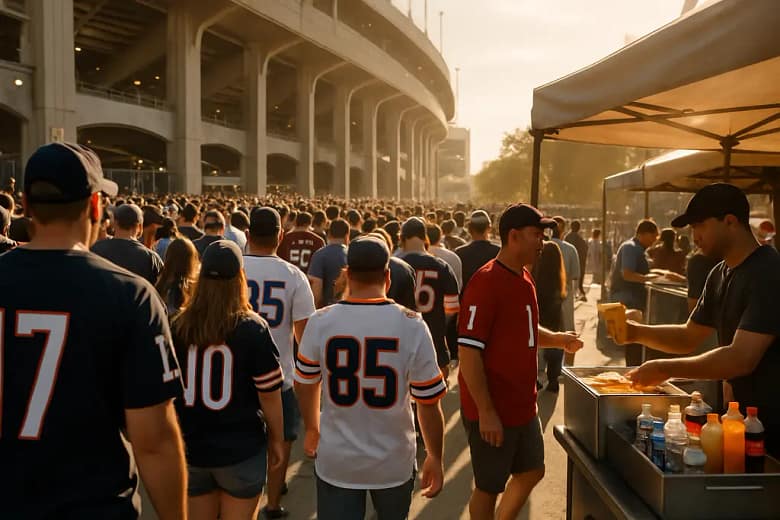
sports tourism 2025 gave event owners, cities, leagues, and athlete-centered organizations a clearer view of how fan travel converts into destination spending. The headline numbers were large, but the better sports story is more practical: hotel nights, ticket-linked trips, transport use, food service demand, staffing, and the public costs that sit beside the revenue case.
For sports leaders, the central question is not whether travel tied to games produced economic activity. It did. The question is how much of that activity was new to host destinations, how evenly benefits reached workers and local businesses, and how future bids should treat risk. A cautious reading matters because global estimates vary by source, category, and forecast period.
That variance should not weaken the case for sports tourism. It should sharpen it. The numbers are useful when they help decision-makers compare event formats, venue plans, fan travel patterns, and public investment standards. They are less useful when they become promotional shorthand without disclosure about what is being counted.
sports tourism 2025 Set The Revenue Baseline
Grand View Research valued the global sports tourism market at USD 803.9 billion in 2025, projected USD 927.9 billion for 2026, and forecast USD 2.78 trillion by 2033, with a compound annual growth rate of about 17.0% according to its sports tourism market report. Those figures placed travel tied to sport in the same conversation as venue development, media scheduling, sponsorship, and host-city planning.
Fortune Business Insights used a lower 2025 base, estimating the market at USD 707.29 billion, with USD 813.38 billion in 2026 and nearly USD 1.98 trillion by 2034 at a projected 11.79% CAGR in its global growth report. The gap between those estimates is not a small technical detail. It signals why cities and rightsholders should ask what each model includes before citing one headline number in a bid document.
sports tourism 2025 As A Benchmark
The strongest reading of sports tourism 2025 is as a benchmark year rather than a single settled value. The research notes also identified Europe as the largest regional market, with about 38% of global revenue, followed by North America and a faster-growing Asia-Pacific segment. That distribution fits a sports calendar shaped by established club competitions, major event infrastructure, and dense transport links in Europe, while also reflecting the expanding pull of events in Asia-Pacific.
Market share does not automatically equal better public value. A region can host more travel activity while still facing uneven returns across neighborhoods, local workers, or smaller venues. For organizers, the better measure is whether event strategy links sport demand to accountable destination outcomes.
What The Spending Numbers Actually Measure
Sports tourism spending is often reported as if every dollar carries the same meaning. It does not. Direct spending counts purchases such as lodging, food, transport, tickets, retail, and other visitor activity. Total economic impact can include indirect and induced effects, which broaden the number through supply-chain and household-spending estimates. Both can be useful, but they answer different questions.
Direct Spending Versus Total Impact
The U.S. figures in the research notes showed why definitions matter. Spectator sports tourism in the United States in 2024, reported in 2025, showed USD 47.1 billion in direct spending, USD 114.4 billion in total economic impact, and 664,860 supported jobs. Those are different layers of the same event economy, not interchangeable claims.
For 2025, U.S. sports tourism travelers were reported at 339 million people, using 191.8 million hotel room nights and spending USD 111.2 billion in host destinations. A related Back2Tap analysis of 2025 direct spending framed why that number should be read with attention to local standards, not just scale.
Those hotel-room figures matter for sports operations because accommodation capacity can shape tournament design. A city with strong venue inventory but limited lodging may struggle with overlapping events, youth tournaments, or postseason travel surges. A city with both venue depth and room capacity has more room to manage multi-day competitions, but still needs plans for transport, security, staffing, and accessibility.
How Events Turn Travel Into Local Value
The sports-first case for tourism starts with competition. Fans travel because fixtures, tournaments, rivalry games, championships, showcases, and participation events give them a reason to move. The business case follows the schedule. A match window can shift hotel occupancy, restaurant demand, ride activity, airport flows, and venue staffing in ways that ordinary leisure travel may not.
Spectators, Participants, And Event Mix
The research notes said spectator and event-based travel, often called passive sports tourism, made up roughly 47.6% to 52.5% of global sports-tourism revenue in 2025. Active sports tourism, meaning participation travel, generated USD 236.2 billion in global sales in 2025 and was described as one of the faster-growing segments.
That distinction matters for event strategy. Spectator travel often concentrates demand around a limited number of high-profile dates. Participation travel can spread activity across youth tournaments, amateur endurance events, club competitions, and training trips. Both can serve a host city, but they place different pressure on fields, arenas, hotels, medical coverage, and volunteer systems.
- Major spectator events can deliver short, intense demand around matchdays and championship weekends.
- Youth and amateur tournaments can create repeat hotel stays across multi-day schedules.
- Participation events can bring athletes, families, coaches, and support staff into smaller markets.
- International football events can link fan travel with wider coverage through sites such as World Football Idol that offer football stories and player profiles.
The policy test is whether the event mix fits local capacity. A host that overstates demand may underprepare for staffing and transport. A host that understates demand may miss chances to bring local vendors, community clubs, and athlete development programs into the economic plan.
Governance Tests For Future Event Bids

Projections for future events should be treated as planning tools, not guarantees. Forecasts can guide capital planning and calendar strategy, but they depend on assumptions about fan travel, prices, hotel supply, transport access, and event frequency. If those assumptions are not disclosed, the projected benefit becomes hard to evaluate.
Taxes, Jobs, And Public Accountability
The research notes reported that non-local attendees tied to U.S. sports-tourism spending in 2024 paid USD 20.5 billion in state and local taxes, including USD 1.6 billion in lodging taxes, and supported about 1.6 million jobs. Those figures show why public officials pay attention to sports travel. They also show why workforce quality belongs in the same discussion as room nights and tax receipts.
Job counts can include full-time, part-time, seasonal, and event-based roles. A city that wants durable value should ask which jobs are being counted, how long they last, and whether local workers have access to training, transport, and predictable scheduling. That is an athlete- and community-centered way to read industry growth: sport can create demand, but leadership determines whether the gains are shared.
The EU data in the research notes took a broader sport-economy view. Its 2025 Sport Satellite Account showed sport and sport-related services creating 6.05 million direct jobs, including 602,000 in accommodation and food services and 131,000 in land transport, with a multiplier effect of about 1.7. While not all of that is tourism, it reinforces the link between sport activity and service-sector employment.
Sports Tourism 2025 Economic Contributions
The fairest assessment of sports tourism 2025 is that it confirmed sports travel as a major economic channel while exposing the need for careful measurement. The market was large under both major global estimates, yet the difference between them was wide enough to demand transparency. U.S. travel and hotel-night figures showed strong destination demand, yet direct spending, total impact, taxes, and jobs each measured a different part of the story.
For future events, the responsible path is practical. Cities should separate direct visitor spending from wider modeled impact, publish assumptions, compare spectator and participation demand, and assess whether venues, hotels, and transport can handle the calendar. Rights holders should present bids that respect local capacity and athlete experience, not just headline revenue.
That is where sports tourism 2025 becomes useful for industry leadership. It gives sports organizations a data-backed starting point for decisions about tournaments, venues, fan travel, and community benefit. The numbers support ambition, but they also argue for discipline: better event calendars, clearer public reporting, and economic plans that start with sport and hold themselves accountable beyond the final whistle.