
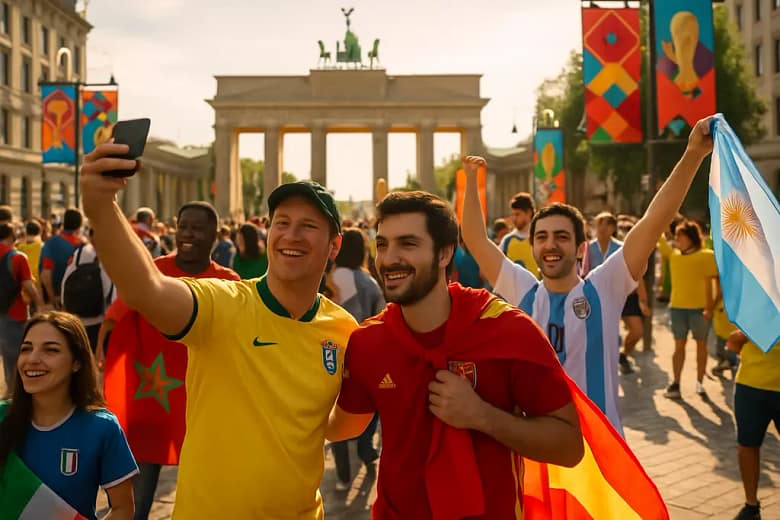
World Cup Travel demand gave the 2026 FIFA World Cup a second scoreboard beyond goals, points, and knockout pressure: the movement of supporters through airports, hotels, short-term rentals, restaurants, and city transit systems. The tournament ran from June 11 to July 19, 2026, across 16 host cities in the United States, Mexico, and Canada, a 39-day format that created a broad test of sports tourism capacity across North America, as outlined by S&P Global.
For host cities, the event was not only a soccer spectacle. It was a live case study in whether global football traffic can turn into durable economic value. The evidence from the tournament points in two directions at once. Air bookings rose sharply in several cities, hotel rates climbed across U.S. host markets, and some short-term rental neighborhoods saw pronounced demand spikes. At the same time, several cities faced softer-than-expected booking pace, and hotel occupancy did not rise everywhere. That mix matters because sports tourism gains are strongest when match-day spending spreads beyond stadium districts and does not simply replace regular summer demand.
How World Cup Travel Demand Shifted By City
The World Cup schedule created bursts of demand rather than one uniform tourism wave. Match allocation, team followings, airport access, hotel inventory, and city brand all affected the local outcome. The result was a tournament in which some markets absorbed a clear visitor surge while others saw signs of displacement or uneven demand.
World Cup Travel Signals In Air Bookings
Air booking data gathered before the tournament showed several U.S. host cities pacing well above the prior year for the tournament window from June 9 to July 18, 2026. Dallas was up 42%, Houston 38%, Kansas City 27%, and Atlanta 14%. Those figures point to strong fan mobility into cities with major airport capacity, stadium access, or favorable match draws. Seattle, by contrast, was down about 16%, showing that hosting alone did not guarantee an air travel lift.
Mexico showed the same uneven pattern. Monterrey was up about 67% in year-over-year flight bookings for the same window, while Guadalajara was down 9% and Mexico City was roughly flat. For sports tourism leaders, that split is a useful warning. Demand depends on more than the event logo. It also depends on route availability, pricing, match timing, hotel stock, and whether traveling supporters see a city as part of a broader trip.
Why The Surge Was Uneven
The World Cup is different from a single-city championship event because fans follow teams, not only venues. A city that hosted marquee fixtures, knockout-stage stakes, or national teams with large traveling support had a different demand profile than a city with fewer tourism triggers. That pattern made local execution important. Airport processing, visitor information, local transportation, and coordination with hospitality operators shaped how well demand could be captured.
There was also a crowding-out question. Some travelers who might have taken ordinary summer trips may have avoided host cities because of price expectations, match-day congestion, or limited room choice. That helps explain why rising prices and rising economic activity did not always translate into stronger occupancy in every market.
Hotels, Rentals, And The Match Calendar
Hotel data from the tournament period showed a clear pricing effect. Average daily rates rose in all 11 U.S. host-city markets during match weeks. That is a direct signal of event-driven pricing power. Yet occupancy fell in seven of those 11 markets compared with a counterfactual baseline, including declines of 6.3 percentage points in Seattle and about 4.6 percentage points in Kansas City and Miami.
Rates Rose Faster Than Occupancy
This split between rate and occupancy is central to the economic reading. Revenue per available room increased in all 11 U.S. host cities, and total incremental rooms revenue across those markets during match weeks was estimated at US$680 million. New York alone accounted for US$339.2 million of that figure, which shows how much value concentrated in a major global hub with deep room inventory and strong international demand.
For hotels, this was a revenue event more than a simple fill-the-building event. Higher rates helped lift returns, but the occupancy softness in several cities suggests that some expected visitors either stayed elsewhere, shortened trips, used alternative lodging, or were offset by non-soccer travelers who stayed away. That is not a failure of the tournament. It is evidence that mega-event gains must be evaluated against normal summer travel, not only against match-day crowd images.
Short-Term Rentals Captured Match-Day Peaks
Short-term rental demand added another layer. In Miami, some neighborhoods saw nightly demand rise 54% to 118% year over year on selected match days between June and July 2026. That kind of spike can benefit property owners and local service businesses, but it also raises questions for city officials about neighborhood capacity, pricing pressure, and enforcement of rental rules.
The lodging story therefore was not a single hotel story. It was a citywide accommodation story split across hotels, rentals, and surrounding suburbs. The economic opportunity was strongest where visitors stayed multiple nights, spent beyond the match, and used local businesses rather than only arriving and leaving around kickoff.
Economic Openings And Limits For Local Markets
The U.S. portion of the tournament was projected to deliver US$30.5 billion in gross output, add US$17.2 billion to U.S. GDP, and create 185,000 jobs, largely in tourism, hospitality, and event services, according to a U.S. Department of Commerce analysis. Those projections framed the World Cup as a major sports-business opportunity, but the host-city evidence suggests the gains were not spread evenly.
Where The Spending Could Spread
The strongest local opportunities sat close to the fan experience: hotels, restaurants, airport services, event staffing, security, merchandise, local tours, transport, and venue operations. Cities that connected match traffic to broader visitor activity had a better chance of extending spending beyond stadium gates. Public viewing areas, downtown programming, and coordinated transit links likely mattered because they gave supporters a reason to remain in the city before and after matches.
Stadium and mobility planning also shaped the fan economy. A host city with clear transit options could move supporters more efficiently, reduce friction around match days, and improve the odds that visitors spent time in multiple districts. For readers tracking the built environment side of the event, Back2Tap has related analysis on World Cup infrastructure planning.
- Opportunity: higher hotel rates, short-term rental spikes, restaurant traffic, airport demand, and event-service jobs.
- Constraint: uneven air bookings, weaker-than-expected hotel pace in some cities, and possible crowding out of regular summer visitors.
- Strategic lesson: host cities needed plans that converted match attendance into multi-day spending.
Why Smaller Markets Needed Precision
Large hubs such as New York had structural advantages: international air access, hotel depth, global recognition, and many attractions outside soccer. Smaller or less internationally known host cities needed sharper coordination. For them, the tournament could create a short window of exposure, but exposure alone does not ensure spending. Visitor information, local business readiness, and transport reliability had to do more of the work.
Some host cities also entered the tournament with booking pace below expectations. An April 2026 survey by the American Hotel & Lodging Association indicated that several U.S. host cities, including Kansas City, San Francisco, Seattle, Boston, and Philadelphia, had hotel booking pace below expectations and even below typical June and July demand profiles. That finding should make future bidders cautious about assuming that every mega-event room block converts into broad demand.
World Cup Travel Lessons For Host Cities
The clearest lesson from World Cup Travel patterns in 2026 is that sports tourism is won locally, even when the event is global. FIFA supplied the tournament platform; cities still had to convert fan movement into economic activity. The match calendar created demand, but local systems determined how much of that demand stayed in the market.
Measure The Event Against The Baseline
Host cities should judge results against what would have happened without the tournament. A full restaurant district on match night looks positive, but the better question is whether the event added spending or replaced ordinary summer activity. The same applies to hotels. Higher average daily rates can lift revenue even if occupancy softens, but the net gain depends on the lost or displaced demand that sits beneath the headline numbers.
This approach also helps public officials communicate with residents. Mega-events often bring road closures, security zones, and price increases. Residents are more likely to see value when leaders report clear, verifiable outcomes: incremental room revenue, visitor nights, local hiring, small-business sales, and post-event tourism retention.
Build A Sports-First Visitor Strategy
A sports-first strategy starts with the supporter. Fans need clear stadium access, late transportation options, safe walking routes, and simple information across languages. Once those basics are in place, the city can connect visitors to food, culture, recreation, and local businesses. If you’re interested in exploring related outdoor and motorsports context, you can find more at Triple T Powersports.
For future host cities, the 2026 case argues for discipline rather than hype. World Cup Travel demand can raise air bookings, room rates, and short-term rental activity, but it can also expose weak planning and inflated forecasts. The cities that gained the most were positioned to serve supporters as sports travelers first, then convert that movement into wider economic value.