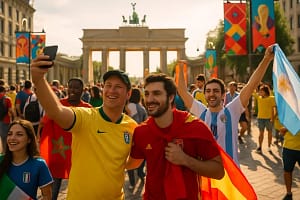
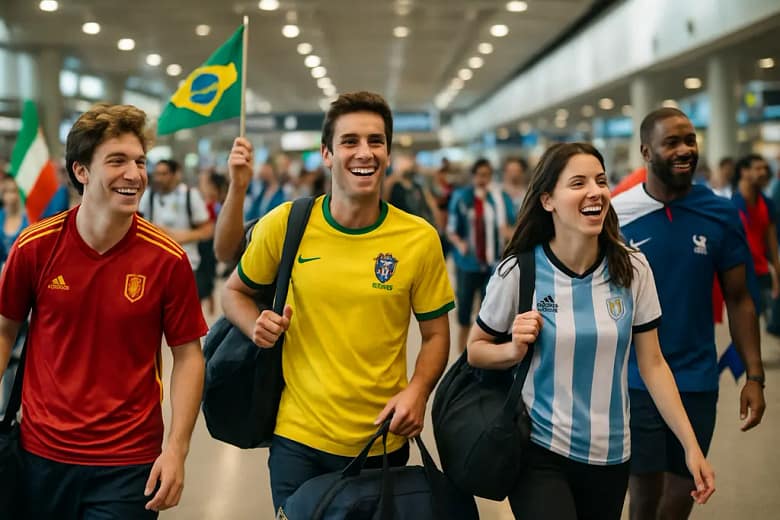
World Cup Travel did not remain a future scenario after the 2026 FIFA World Cup ran from June 11 to July 19, 2026, across 16 host cities in the United States, Canada, and Mexico. As of September 29, 2026, the most reliable figures in the research set are still forecast-based, not a full public accounting of final local receipts. That matters because the headline projection, US$8.1 billion in traveler spending across North American host cities from June through August 2026, was large enough to shape hotel pricing, city planning, and public expectations.
The sports case is clear: a 104-match tournament can move people at a scale that few events can match. The harder question is whether host cities turned match traffic into measurable local value after costs, displacement, and uneven neighborhood gains are considered. For athletes and teams, the tournament was about performance. For host cities, it became a live test of whether soccer-driven tourism could support hotels, restaurants, transport systems, security plans, and local businesses without overstating the net return.
World Cup Travel After The $8.1B Forecast
Expedia Group and PredictHQ projected that traveler spending in North America’s host cities would exceed US$8.1 billion between June and August 2026, about US$750 million higher than the same period in 2025, according to Expedia Group research. The same forecast put accommodation spending at US$4.8 billion, up from US$2.6 billion in June through August 2025. That lodging share is the central sports-tourism signal because match attendance often shows up first in hotel bookings, room rates, and length-of-stay patterns.
Still, forecasted spend is not the same as host-city benefit. Gross visitor spending can include money captured by national hotel chains, third-party booking platforms, airlines, or vendors that are not locally owned. Cities need post-event audits that separate total traveler outlay from local tax receipts, small-business revenue, public safety costs, transport spending, and any displacement of normal summer visitors. Without that separation, a large tournament can look stronger on paper than it felt in some neighborhoods.
The Lodging Share Changed The Debate
The forecasted jump from US$2.6 billion to US$4.8 billion in accommodation spending put hotels at the center of the 2026 story. In sports terms, lodging was not a side category; it was one of the main scoreboards for host-city demand. Higher room revenue can help local tax collections, but it can also pressure visiting families, traveling supporters, event workers, and media teams. A credible post-event review should ask who paid higher rates, who received the revenue, and how much flowed back into city services tied to tournament operations.
This is where World Cup Travel should be assessed with discipline. A city that filled rooms and raised rates may have had a strong business month, but that does not automatically prove broad community gain. The better measure is narrower and more accountable: incremental spending that would not have happened without the matches, minus public and private costs required to stage and serve the surge.
Host Cities Saw Uneven Demand Signals
The research points to a host-city pattern that was not uniform. Kansas City, Missouri, showed a 135% year-over-year increase in travel intent, a 35% rise in hotel average daily rate, and 305% growth in ADR relative to pre-World Cup performance. Monterrey, Mexico, had the highest lodging demand growth among host cities at 255% year over year, while travel intent doubled compared with the prior year. Those figures show why local soccer markets and venue footprints mattered.
World Cup Travel Signals In Kansas City
World Cup Travel in Kansas City stood out because travel intent and hotel pricing moved sharply in the same direction. For a market that is not always placed in the same tourism tier as New York, Los Angeles, or Mexico City, that type of tournament-driven attention can be valuable. Yet the same numbers also call for caution. A 35% ADR increase can lift hotel revenue while making the trip more expensive for supporters. The post-event question is whether that price movement brought repeat visitation potential or mostly reflected a short competition window.
Monterrey And Secondary Market Strength
Monterrey’s 255% lodging demand growth shows that host-city value was not limited to the largest U.S. metros. A high-growth market can benefit when match schedules, regional fan bases, and available lodging align. But a demand spike is not the same as long-term tourism conversion. Local agencies still need to compare June and July activity with later booking behavior, return visits, and how many businesses outside stadium-adjacent areas saw measurable benefit.
Other host-city lodging projections also showed sharp movement. Hotelier Magazine reported Arlington, Texas at US$562 million in projected lodging spend, up 135% year over year, while Foxborough, Massachusetts and Santa Clara, California were projected for lodging-spend increases of 161% and 159%, respectively, as noted by Hotelier Magazine. Those markets have different venue locations, transport realities, and hotel bases, so comparing them only by percentage growth would miss key local conditions.
What Cities Should Measure Beyond Spending

For city leaders, sports commissions, and tournament organizers, the task after a major soccer event is not to defend a projection. It is to test it. The research offers strong indicators of travel demand, especially in lodging, but public confidence depends on a clearer review of costs and benefits. That review should be sports-first, because the tournament existed to stage elite soccer, but it should also be honest about who carried the operational burden.
- Separate gross traveler spending from incremental local economic gain.
- Compare hotel revenue growth with occupancy, rate changes, and tax receipts.
- Track whether small businesses away from stadium zones saw match-related activity.
- Review public safety, transport, sanitation, and event-management costs against revenue gains.
- Assess access issues for supporters, workers, volunteers, and local residents during match periods.
That type of review also protects athlete-centered priorities. Teams need efficient movement, safe training environments, and predictable operations around matchdays. If host cities overbuild the tourism narrative and undercount basic event services, the pressure can shift toward players, staff, and supporters who are already dealing with a compressed international tournament schedule.
For readers tracking related soccer business coverage, SCAR Sports is an excellent resource about sport, fans, and host-market outcomes, accessible through SCAR Sports. Back2Tap has also examined the post-event fan movement question through its analysis of World Cup tourism after 2026, which fits the same need for careful review rather than celebration by headline number alone.
What The $8.1B Soccer Travel Boost Means
The US$8.1 billion forecast gave North America’s 2026 soccer summer a powerful business frame, but the responsible reading is narrower. World Cup Travel created clear demand signals, especially in accommodation, and several host cities appeared positioned for large lodging gains. The evidence in the provided research does not yet prove final net benefit city by city.
The next standard should be transparency. Host cities that gained should be able to show how much was new spending, where it landed, and which public costs were required to support it. Cities that saw uneven returns should say so. That is not anti-event; it is pro-sport and pro-community. Major soccer tournaments can bring real value, but the strongest case for them is built after the final whistle, when projections are tested against receipts, services, and local impact.